

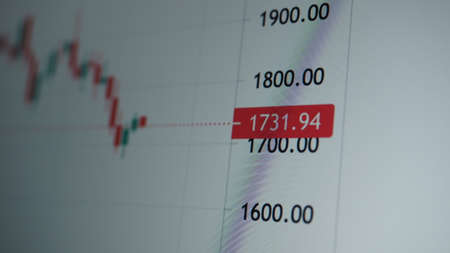
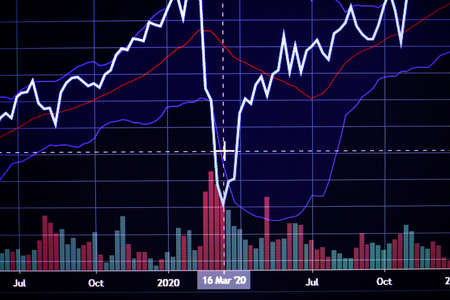
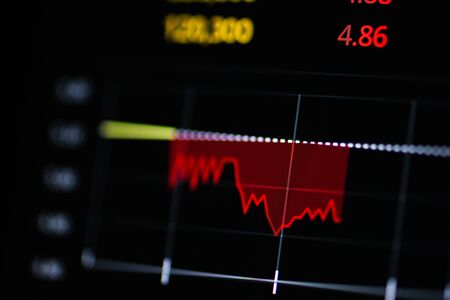
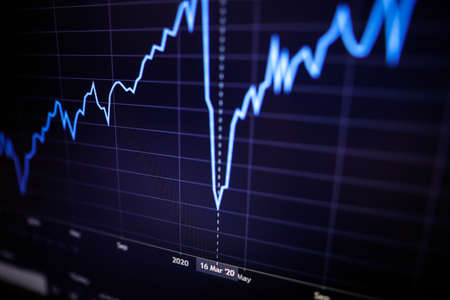
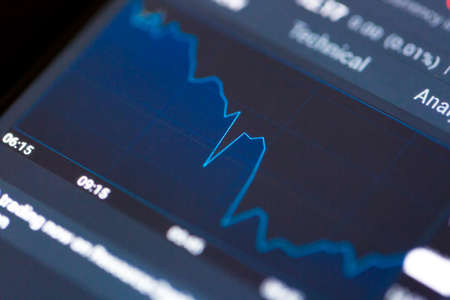
Shallow depth of field (selective focus) with details of a chart showing the stock market crash from March 2020 due to the Covid-19 pandemic on a computer screen (S&P500 index)
Коллекция по умолчанию
Коллекция по умолчанию
Создать новую

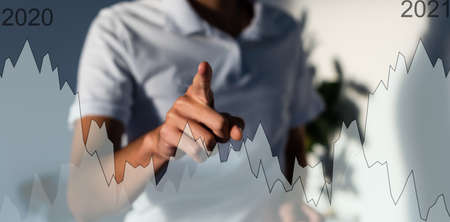
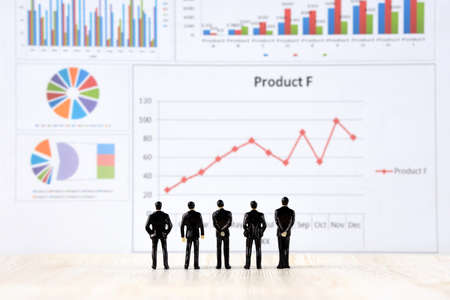
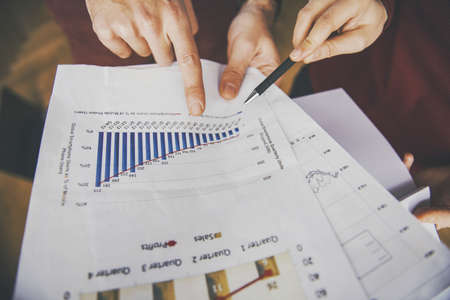
Businessmen miniature figure standing on investment and profit graph for analysis and discussion.
Коллекция по умолчанию
Коллекция по умолчанию
Создать новую

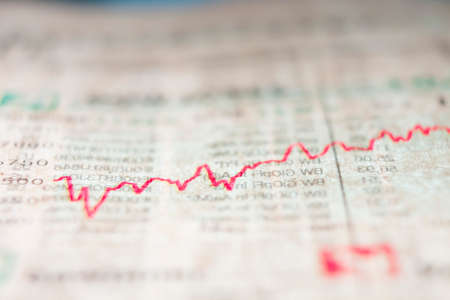
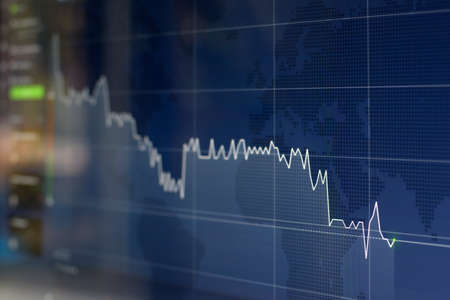
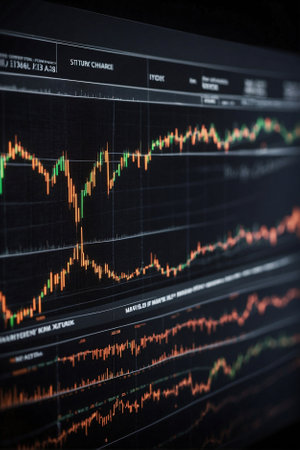
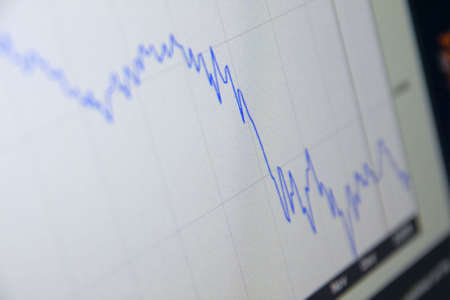
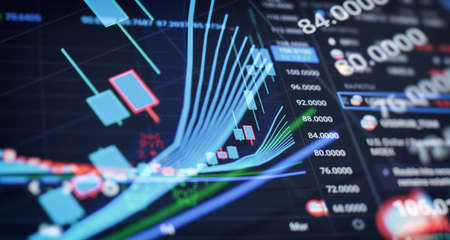
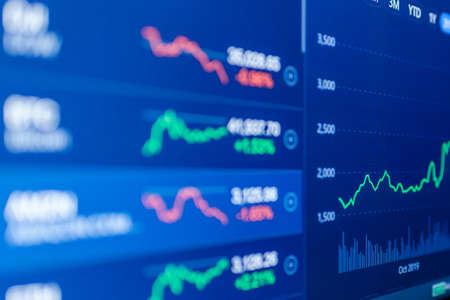
image of the financial graph on a computer monitor.
Коллекция по умолчанию
Коллекция по умолчанию
Создать новую

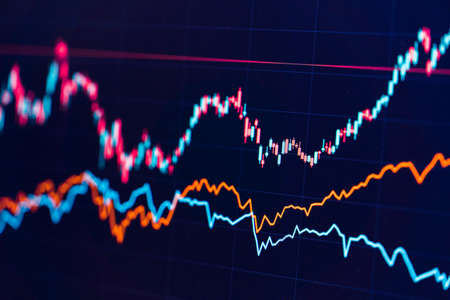
Abstract candlestick chart on white digital screen. Stock market or crypto data chart, graph with rectangular grid on light background.
Коллекция по умолчанию
Коллекция по умолчанию
Создать новую
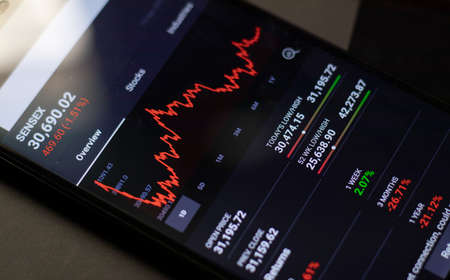
Maski, India - April 14, 2020 : Crash in sensex share market on mobile during covid-19 lockdown.
Коллекция по умолчанию
Коллекция по умолчанию
Создать новую
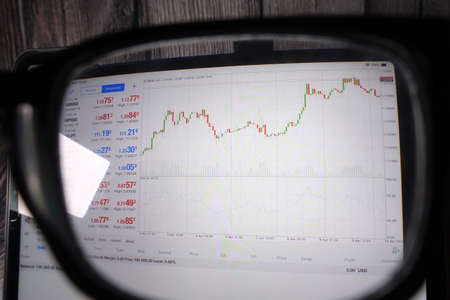
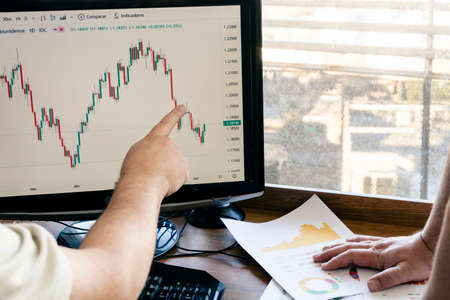
Trading forex with METATRADER 4 on Apple iPad Pro 11 inch. iPad Pro is the most user friendly which good for people on the go.
Коллекция по умолчанию
Коллекция по умолчанию
Создать новую

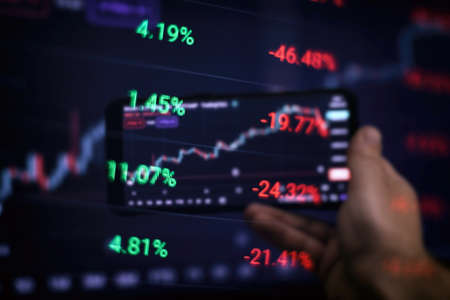
Trader investor broker holding finger using cell phone app executing financial stock trade market trading order to buy or sell
Коллекция по умолчанию
Коллекция по умолчанию
Создать новую

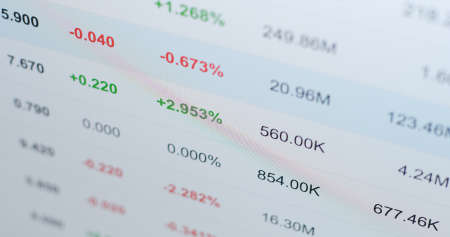
Online stock exchange application with information on screen, closeup
Коллекция по умолчанию
Коллекция по умолчанию
Создать новую

Business financial or stock market background. Business graph on stock market financial exchange
Коллекция по умолчанию
Коллекция по умолчанию
Создать новую

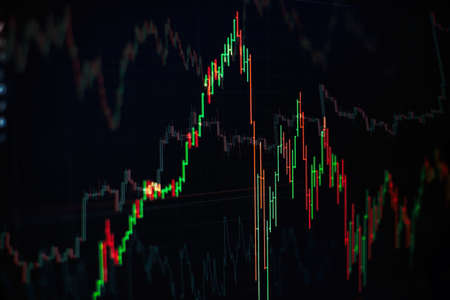
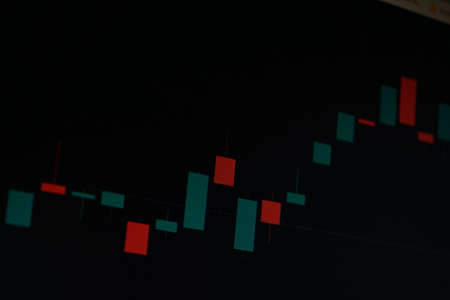
A stock market graph on a black background.
Коллекция по умолчанию
Коллекция по умолчанию
Создать новую

Virus pandemic covid-19 map on pc screen, global infection, internet.
Коллекция по умолчанию
Коллекция по умолчанию
Создать новую
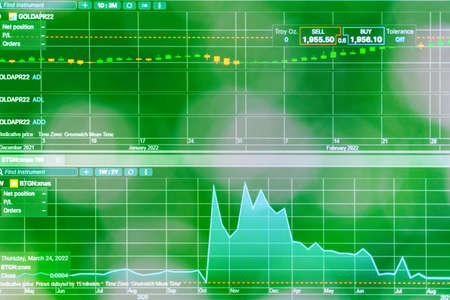
World GOLD Spot Stock market graph indicator on monitor. Gold graph on digital screen monitor for invester analysis. trading gold spot on stock market. Gold Investing Finance and Economic concept.
Коллекция по умолчанию
Коллекция по умолчанию
Создать новую
Working set for analyzing financial statistics and analyzing a market data. Data analysis from charts and graphs
Коллекция по умолчанию
Коллекция по умолчанию
Создать новую

graph of financial growth on a computer monitor.
Коллекция по умолчанию
Коллекция по умолчанию
Создать новую

Financial instruments with various types of indicators including volume analysis for professional technical analysis
Коллекция по умолчанию
Коллекция по умолчанию
Создать новую

Sales profit numbers changing on monitor after global trade, real time exchange market stocks statistics growing. Financial graphs showing money trend, risk buying. Close up. Tripod shot.
Коллекция по умолчанию
Коллекция по умолчанию
Создать новую
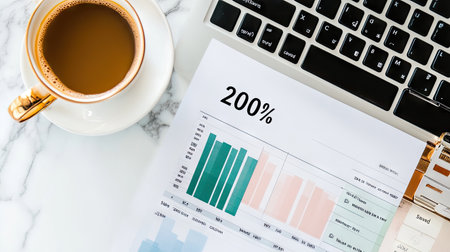
A modern workspace scene featuring a cup of coffee beside a laptop, with charts and graphs showcasing data analysis for productivity and business growth.
Коллекция по умолчанию
Коллекция по умолчанию
Создать новую

Data analyzing in Forex, Commodities, Equities, Fixed Income and Emerging Markets: the charts and summary info show about Business statistics and Analytics value - Wealth management concept.
Коллекция по умолчанию
Коллекция по умолчанию
Создать новую

Financial stock market graph. Stock Exchange. Selective focus.
Коллекция по умолчанию
Коллекция по умолчанию
Создать новую
Daily trading prices stock market graph showing on the screen.Daily investor's business everyday life.Selective focus.Telsiai,Lithuania.03-26-2022
Коллекция по умолчанию
Коллекция по умолчанию
Создать новую

Financial report and laptop on business desk
Коллекция по умолчанию
Коллекция по умолчанию
Создать новую

Team work with results and reports
Коллекция по умолчанию
Коллекция по умолчанию
Создать новую

Financial stock market graph. Stock Exchange. Selective focus.
Коллекция по умолчанию
Коллекция по умолчанию
Создать новую
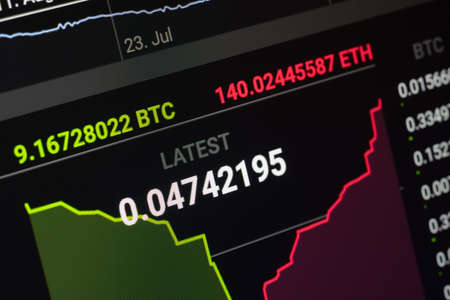
Cryptocurrency stock market trading Stock analysis concept. BTC and ETH cryptocurrency stock trading.
Коллекция по умолчанию
Коллекция по умолчанию
Создать новую
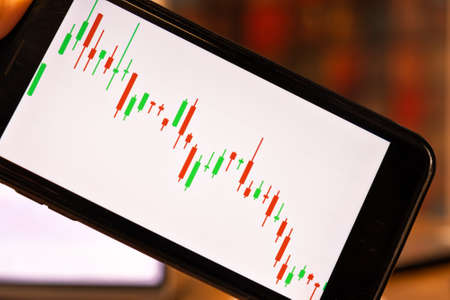
Close up n hand holding smart phone with candle graph for trade stock market investment crypto currency
Коллекция по умолчанию
Коллекция по умолчанию
Создать новую

financial graph
Коллекция по умолчанию
Коллекция по умолчанию
Создать новую
businessman hand working with virtual chart business on touch screen computer as concept
Коллекция по умолчанию
Коллекция по умолчанию
Создать новую
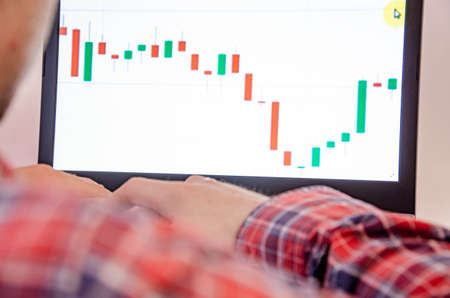
Trading on the exchange. Men's hands in a plaid shirt at a laptop. On-screen rates, promotions. Schedule Wins are losses. Part of the back and head is visible. Focus on laptop and graphics
Коллекция по умолчанию
Коллекция по умолчанию
Создать новую

Colored sticker stripes on business analytics chart closeup
Коллекция по умолчанию
Коллекция по умолчанию
Создать новую

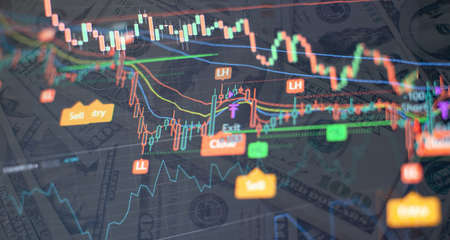
Fundamental and technical analysis concept.
Коллекция по умолчанию
Коллекция по умолчанию
Создать новую
Stock exchange, cryptocurrency price chart on a screen. Candlestick chart, btc. Online currency exchange market. Trading, bidding. Tracking the cryptocurrency rate. 4K. Close up.
Коллекция по умолчанию
Коллекция по умолчанию
Создать новую
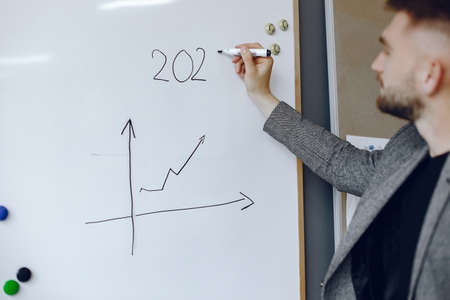
Man draws a chart on a poster
Коллекция по умолчанию
Коллекция по умолчанию
Создать новую
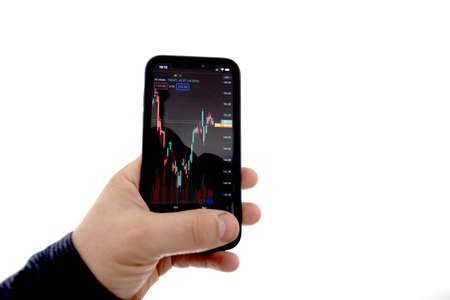
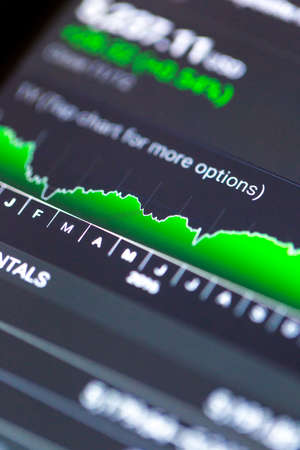
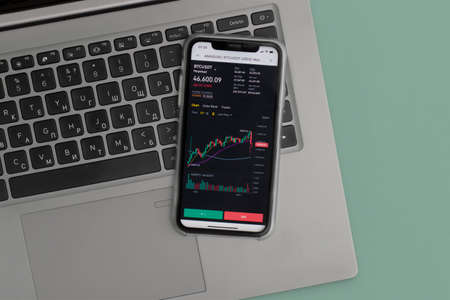
Stock market investment app in hand. Telephone with a stock chart. Screen close-up
Коллекция по умолчанию
Коллекция по умолчанию
Создать новую

Close-up view of a laptop displaying data analysis with charts and graphs, perfect for showcasing technology, finance, or business analytics themes.
Коллекция по умолчанию
Коллекция по умолчанию
Создать новую
Shallow depth of field (selective focus) with details of a chart showing the stock market crash from March 2020 due to the Covid-19 pandemic on a computer screen (S&P500 index)
Коллекция по умолчанию
Коллекция по умолчанию
Создать новую
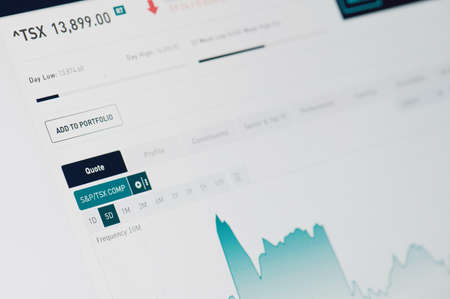
New-York , USA - April 17 , 2020: Graph in Toronto Stock Exchange close up view on computer screen
Коллекция по умолчанию
Коллекция по умолчанию
Создать новую

Top view of laptop and printed charts on office table
Коллекция по умолчанию
Коллекция по умолчанию
Создать новую
The business plan at the meeting and analyze financial numbers to view the performance of the company.
Коллекция по умолчанию
Коллекция по умолчанию
Создать новую
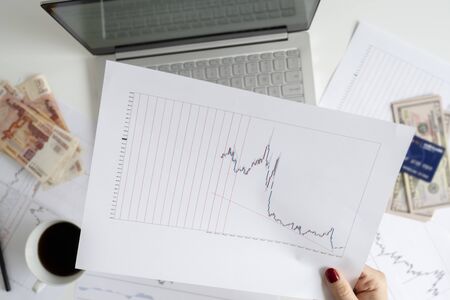
Woman freelancer. pack of banknotes fifty U.S. dollars, five thousand rubles, credit card and laptop with graphics and charts on office table. Forex exchange concept, Flat lay.
Коллекция по умолчанию
Коллекция по умолчанию
Создать новую

Kuala Lumpur, Malaysia, 24th July 2020: Close up Instagram application menu on smartphone screen. Instagram is a photo and video-sharing social networking service owned by Facebook.
Коллекция по умолчанию
Коллекция по умолчанию
Создать новую
Stock Chart Macro Concept Bright
Коллекция по умолчанию
Коллекция по умолчанию
Создать новую

A detailed close-up view of a candlestick chart displaying stock data. The graphic illustrates financial trends with vibrant colors, aiding data analysis.
Коллекция по умолчанию
Коллекция по умолчанию
Создать новую
Business and trading finance contept. Stock exchange market chart view on smart phone screen.
Коллекция по умолчанию
Коллекция по умолчанию
Создать новую
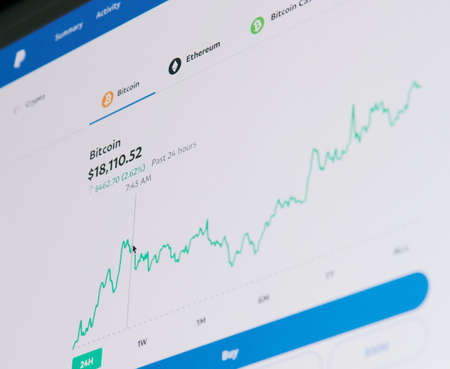
New york, USA - November 20, 2020: Buying bitcoin via paypal service on screen laptop close up view
Коллекция по умолчанию
Коллекция по умолчанию
Создать новую

Business and Economy Theme. Trading Cryptocurrencies. Stock Market Candles Chart on Computer Display Close Up.
Коллекция по умолчанию
Коллекция по умолчанию
Создать новую
Indicators including volume analysis for professional technical analysis on the monitor of a computer. Fundamental and technical analysis concept.
Коллекция по умолчанию
Коллекция по умолчанию
Создать новую

Chalkboard with ladder made of wooden blocks arrows up. Increase, rise, grow up. Business statistic. Career, money, success. Financial progress step by step on stacking blocks. Business flat lay.
Коллекция по умолчанию
Коллекция по умолчанию
Создать новую
Financial stock market graph on the tablet screen on cement background. Top view. Stock Exchange.
Коллекция по умолчанию
Коллекция по умолчанию
Создать новую
Statistics & Business
Коллекция по умолчанию
Коллекция по умолчанию
Создать новую
Ufa, Russia November 11, 2021: Laptop screen with stock market charts. Technical analysis and fundamental indicators of stock quotes in the trading terminal. Japanese candlesticks and company tickers.
Коллекция по умолчанию
Коллекция по умолчанию
Создать новую
Analysis business accounting on info sheets. Businessman hand working on analyzing investment charts for Gold market, Forex market and Trading market.
Коллекция по умолчанию
Коллекция по умолчанию
Создать новую

Stock market data.Online trading,investing platform on the computer screen.Blurred background.
Коллекция по умолчанию
Коллекция по умолчанию
Создать новую
MOSCOW, RUSSIA - 11 SEP 2021: Stock market online. Business concept
Коллекция по умолчанию
Коллекция по умолчанию
Создать новую

Financial stock market graph. Stock Exchange. Selective focus.
Коллекция по умолчанию
Коллекция по умолчанию
Создать новую
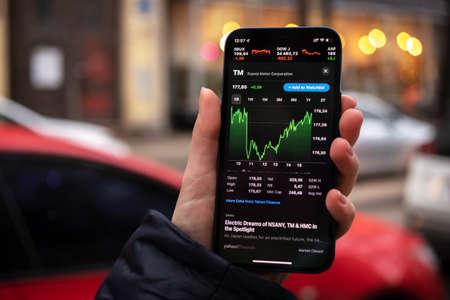
Kharkov, Ukraine - December 1, 2021: Toyota TM stock trade. Financial graphs, investment, digital banking concept photo. Smartphone with stock market app in hand
Коллекция по умолчанию
Коллекция по умолчанию
Создать новую
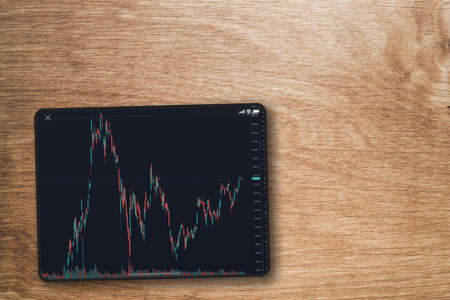
Financial stock market graph on the tablet screen on wooden background. Top view. Stock Exchange.
Коллекция по умолчанию
Коллекция по умолчанию
Создать новую

A colorful wooden block with an arrangement of stair or graph.
Коллекция по умолчанию
Коллекция по умолчанию
Создать новую
Stock market data
Коллекция по умолчанию
Коллекция по умолчанию
Создать новую
Business Concept - Analysis
Коллекция по умолчанию
Коллекция по умолчанию
Создать новую
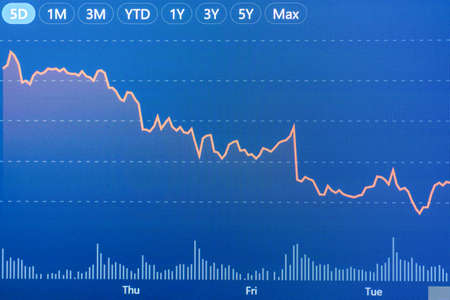
Line chart showing market trading conditions on blue background.
Коллекция по умолчанию
Коллекция по умолчанию
Создать новую

Analysis of data from graphs. select focus.
Коллекция по умолчанию
Коллекция по умолчанию
Создать новую

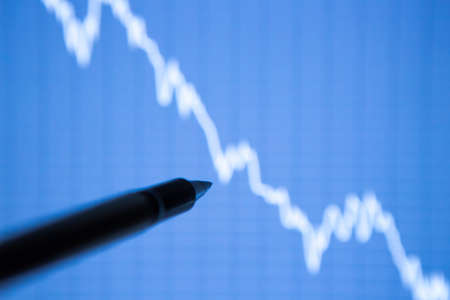
business graph with pen
Коллекция по умолчанию
Коллекция по умолчанию
Создать новую
A stock investor shows another investor the behavior of a stock on the stock market on the monitor. Concept economy, stock market.
Коллекция по умолчанию
Коллекция по умолчанию
Создать новую
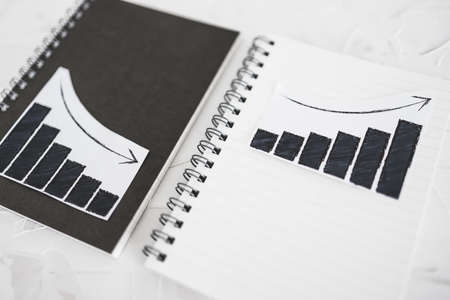
business analysis and statistics concept, positive and negative trends on graphs on notebooks side by side
Коллекция по умолчанию
Коллекция по умолчанию
Создать новую

Analysis business accounting on info sheets. Businessman hand working on analyzing investment charts for Gold market, Forex market and Trading market.
Коллекция по умолчанию
Коллекция по умолчанию
Создать новую

The Stock Exchange, Streaming Trade Screen, The stock screen shows a list of stocks with reduced value.
Коллекция по умолчанию
Коллекция по умолчанию
Создать новую

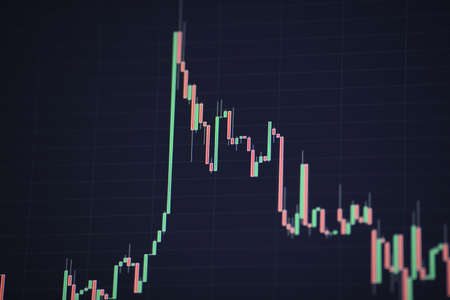
Shallow depth of field (selective focus) with details of a candlestick chart on a computer screen.
Коллекция по умолчанию
Коллекция по умолчанию
Создать новую
View of Stock Market Crash from Covid-19 Pandemic with shallow depth of field.
Коллекция по умолчанию
Коллекция по умолчанию
Создать новую
price graph and indicator, red and green candlestick chart on blue theme screen, market volatility, up and down trend. Stock trading, cryptocurrencies background.
Коллекция по умолчанию
Коллекция по умолчанию
Создать новую

market analyze. Bar graphs, Diagrams, financial figures. Abstract glowing forex chart interface wallpaper. Investment, trade, stock, finance
Коллекция по умолчанию
Коллекция по умолчанию
Создать новую
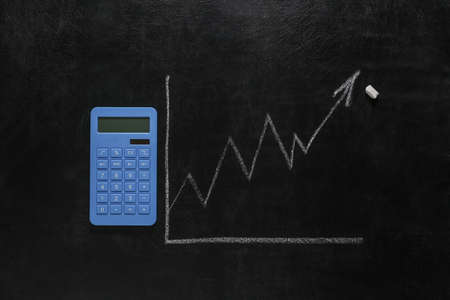
Growth arrow graph drawn on school chalk board and calculator
Коллекция по умолчанию
Коллекция по умолчанию
Создать новую

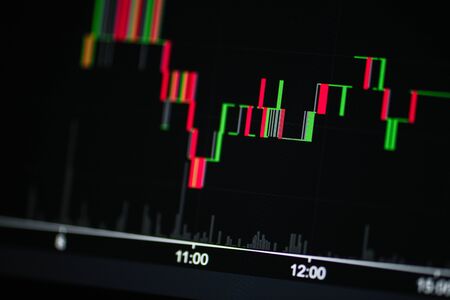
Stock market candlestick chart, asset prices movement, currency exchange price action simple concept. Computer screen, display, candle chart, graph detail, extreme closeup, nobody, no people
Коллекция по умолчанию
Коллекция по умолчанию
Создать новую
Shallow depth of field (selective focus) with details of a chart showing the stock market crash from March 2020 due to the Covid-19 pandemic on a computer screen (S&P500 index)
Коллекция по умолчанию
Коллекция по умолчанию
Создать новую
Stock Market Chart on Dark Background: Financial Analytics. Digital Art: Modern Technologies
Коллекция по умолчанию
Коллекция по умолчанию
Создать новую
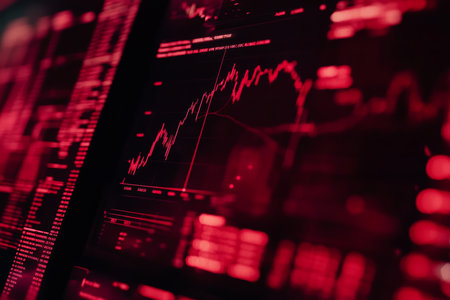
Financial diagram in crisis time. Macro shot taken from monitor screen, shallow DOF.
Коллекция по умолчанию
Коллекция по умолчанию
Создать новую
Financial stock market graph. Stock Exchange. Selective focus.
Коллекция по умолчанию
Коллекция по умолчанию
Создать новую
A financial chart illustrates a notable surge in stock market profits, fueled by rising interest rates and consistent growth in money investments during recent months.
Коллекция по умолчанию
Коллекция по умолчанию
Создать новую
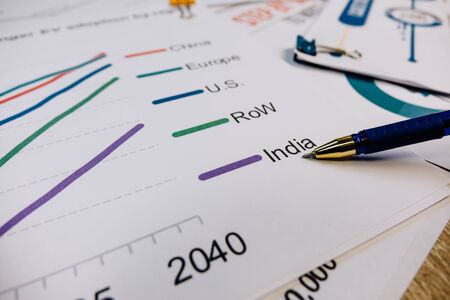
the pen points to the chart layer with the word India.
Коллекция по умолчанию
Коллекция по умолчанию
Создать новую
An office worker shows his colleagues a presentation with a company development graph at night on the company's computer
Коллекция по умолчанию
Коллекция по умолчанию
Создать новую
Stock market business graph chart on digital screen
Коллекция по умолчанию
Коллекция по умолчанию
Создать новую
Business reports
Коллекция по умолчанию
Коллекция по умолчанию
Создать новую
Financial statistics, stock exchange prices summarized in candle stick chart.
Коллекция по умолчанию
Коллекция по умолчанию
Создать новую
Stock Market Trading Chart Investment Analysis Business Index Chart Finance Board Chart
Коллекция по умолчанию
Коллекция по умолчанию
Создать новую
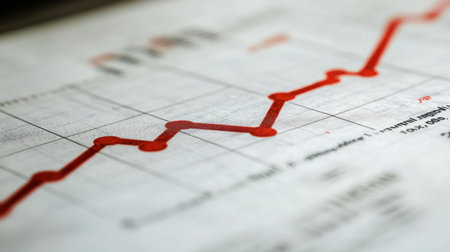
Close-up of a business chart showing a rising trend line, symbolizing growth and progress in financial performance. Ideal for economic insights.
Коллекция по умолчанию
Коллекция по умолчанию
Создать новую
The analysis of the chart of data on the display. Data analyzing in forex market: the charts and quotes on display. Analytics trends
Коллекция по умолчанию
Коллекция по умолчанию
Создать новую
Stock market trading graph in graphic concept.financial investment or economic trends business design. Abstract finance background.Low angle shot.
Коллекция по умолчанию
Коллекция по умолчанию
Создать новую
Changes in the exchange rate of the euro and the dollar. Currency exchange schedule
Коллекция по умолчанию
Коллекция по умолчанию
Создать новую
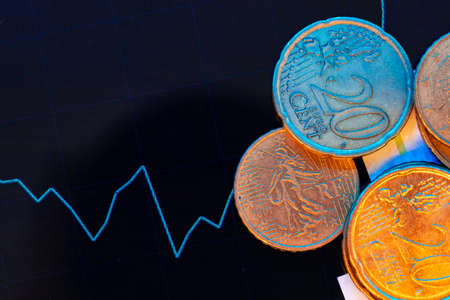
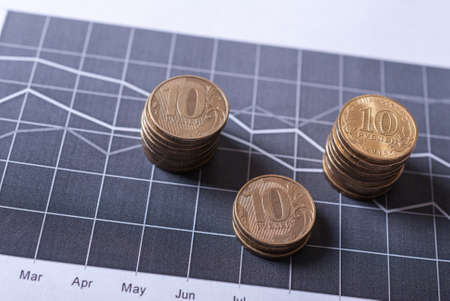
Euro cent coins on black background with graph
Коллекция по умолчанию
Коллекция по умолчанию
Создать новую

Close-up of a stock market analysis chart with a mix of bar graphs and line graphs highlighting key data
Коллекция по умолчанию
Коллекция по умолчанию
Создать новую
Coins on financial charts. Business and financial concept
Коллекция по умолчанию
Коллекция по умолчанию
Создать новую
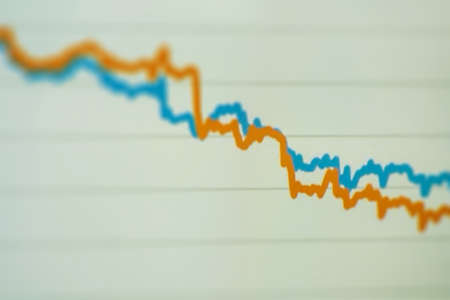
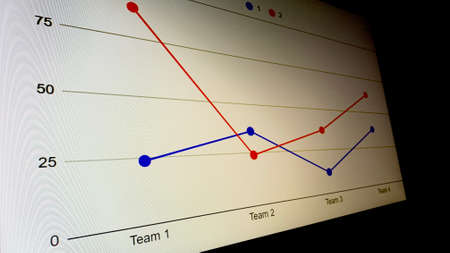
Two lines chart at comparision concept. Data analysis graph. Financial chart, analyzing report concept
Коллекция по умолчанию
Коллекция по умолчанию
Создать новую
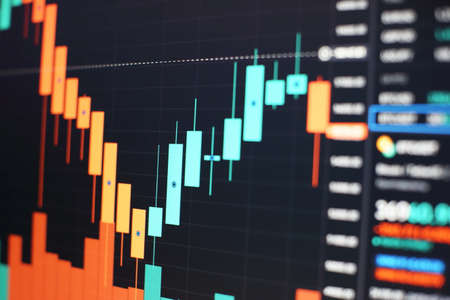
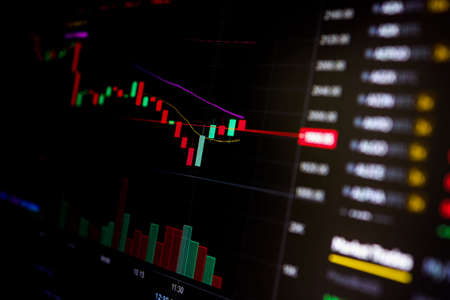
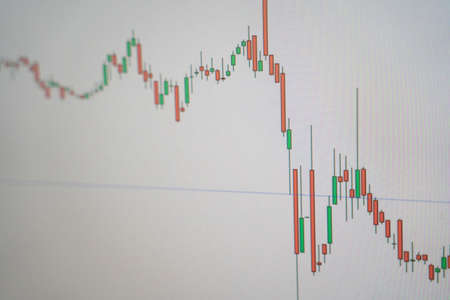
Stock exchange market chart background. Candle stick graph chart with indicator.
Коллекция по умолчанию
Коллекция по умолчанию
Создать новую
The Stock Exchange, Streaming Trade Screen, The stock screen Show the stock price rise.
Коллекция по умолчанию
Коллекция по умолчанию
Создать новую
Business and trading finance contept. Stock exchange market chart view on smart phone screen.
Коллекция по умолчанию
Коллекция по умолчанию
Создать новую
Grow Stock market trading graph in graphic concept.financial investment or economic trends business design. Abstract finance background.Low angle shot.
Коллекция по умолчанию
Коллекция по умолчанию
Создать новую
Dynamic digital interface illustrating stock market trends with red highlights and data analysis
Коллекция по умолчанию
Коллекция по умолчанию
Создать новую
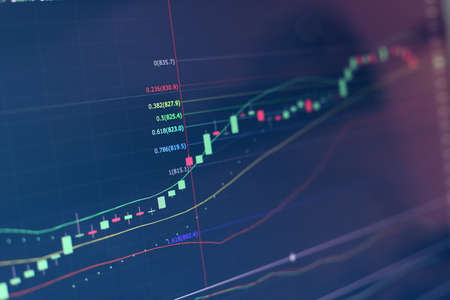
Stock market graph on screen. Ticker on monitor screen. Investing, Finance and Economic concept. Shallow depth of field.
Коллекция по умолчанию
Коллекция по умолчанию
Создать новую

Candle stick graph chart with indicator showing bullish point or bearish point, up trend or down trend of price of stock market or stock exchange trading, investment and financial concept.
Коллекция по умолчанию
Коллекция по умолчанию
Создать новую
Candle stick graph chart with indicator showing bullish point or bearish point, up trend or down trend of price of stock market or stock exchange trading, investment and financial concept. thin focus.
Коллекция по умолчанию
Коллекция по умолчанию
Создать новую
Monthly percentage bar chart showing financial comparison of 2026 budget versus actual performance data displayed on digital screen. Results tracking.
Коллекция по умолчанию
Коллекция по умолчанию
Создать новую
Legion-Media
Создайте свои проекты на основе качественных стоковых фотографий и видео.


Copyright © Legion-Media.